
Data Is Pouring In — But Is Anyone Acting on It?
Across India in 2026, schools and colleges are rapidly adopting RFID smart ID cards, QR-based attendance apps, and AI-powered tracking systems. The Business Standard recently highlighted how RFID and QR technologies are transforming attendance management in the Indian educational sector — and the momentum is unmistakable.
But here is the problem most administrators quietly face: the hardware is installed, the data is flowing, and yet decisions are still being made on gut feel. Registers are gone, yes — but are the reports actually being read? Are they leading to action, or just sitting inside a dashboard nobody opens after the first week?
This guide is for principals, vice-principals, and college registrars who want to move from collecting attendance data to genuinely using it.
Why Most Attendance Reports Fail to Drive Action
The fault is rarely with the data. It is almost always with how reports are structured, delivered, and assigned to someone responsible. Here are the three most common failure patterns in Indian schools:
- Too much, too late: A 200-row Excel file lands in the principal's inbox every Friday afternoon. By Monday morning, the context is gone.
- No clear threshold: The report shows 68% attendance for a student. Is that a crisis or acceptable? Without a defined threshold, nobody escalates.
- Wrong recipient: Attendance data goes to the IT coordinator, not the class teacher or HOD who can actually intervene with a student or parent.
Fixing these three patterns — before you even think about upgrading your hardware — will immediately improve how your institution uses attendance intelligence.
The Five Reports Every School Should Review Weekly
Not all reports are equally useful. Prioritise these five, and delegate who reviews each one:
1. Daily Absentee Alert (Automated, Real-Time)
This is not a report you read — it is one the system sends automatically. The moment a student misses roll call, their class teacher and parent receive an SMS or app notification. No manual follow-up needed. If your current system does not do this by default, that is the first gap to close.
2. Weekly At-Risk Student Report
Pull every student whose attendance has dropped below 75% in the past 30 days. This number is not arbitrary — it aligns with UGC and most state board requirements for minimum attendance to sit examinations. Class teachers should receive this list every Monday morning, not the principal. The principal should see only those cases where a teacher's intervention has not worked within one week.
3. Class-Wise Trend Report
If Class 10-B shows 62% average attendance on Thursdays but 89% on Mondays, that is a curriculum or timetabling signal — not a student discipline problem. Reviewing class-level patterns by day of week helps academic coordinators identify whether a particular subject, teacher slot, or post-lunch period is consistently low-attendance.
4. Teacher Punctuality Report
Jharkhand recently made headlines by implementing geo-fenced technology to ensure teachers mark attendance only from campus. The underlying principle applies everywhere: teacher attendance data should be reviewed separately from student data, and on a monthly basis by the principal directly. This is a sensitive report — handle it with discretion, but do not skip it.
5. Monthly Parent Engagement Summary
How many SMS alerts were delivered? How many parents logged into the app to view their child's record? How many responded to a low-attendance flag? This report tells you whether your parent communication channel is working or whether families are ignoring notifications. A low open rate signals you need to run a parent orientation session, not send more alerts.
Setting Thresholds That Trigger Action — Not Anxiety
One of the most practical things a principal can do this academic year is to publish a clear, written Attendance Intervention Policy. Here is a simple three-tier model used by several CBSE schools:
- Yellow Zone (75–80%): Class teacher calls the parent. Logged in the student's record.
- Orange Zone (65–74%): Counsellor meeting with student and parent. Vice-principal informed.
- Red Zone (below 65%): Principal's formal letter to parents. Eligibility for exams flagged by the exam coordinator.
When your attendance system can automatically colour-code students against these thresholds in a live dashboard, your staff spends zero time calculating who is at risk. They spend all their time on the intervention that matters.
Making Reports Mobile-Friendly for Teaching Staff
Most class teachers in India are not sitting at a desktop PC. They are moving between classrooms, staffrooms, and corridors. Any attendance report that requires logging into a web portal on a laptop will be ignored by 80% of your teaching staff within a month of launch.
The practical fix: ensure your attendance system delivers push notifications and summary cards directly to the teacher's smartphone. A simple morning message — "Class 9-A: 3 students absent today — Riya, Arjun, and Meera" — is infinitely more actionable than a formatted PDF that arrives by email.
Annual Reports: The Data Your Management Committee Actually Wants
At the end of each academic year, your board of trustees or management committee will ask one question: Is attendance improving? Prepare a one-page summary that shows:
- School-wide average attendance, year-on-year comparison
- Percentage of students who remained above 75% throughout the year
- Number of parental alerts sent and average response time
- Classes or grades where attendance improved most after system adoption
This is also your strongest internal justification for continuing — and expanding — your investment in attendance technology.
How RFID and QR Systems Make All of This Automatic
The reports described above are not hypothetical. They are standard outputs of a well-configured RFID or QR attendance platform. When a student taps their smart ID card at the school gate, or scans a QR code at the classroom door, that single action feeds every report listed in this guide — in real time, without any manual data entry.
The difference between a school that uses this data well and one that does not is rarely the technology. It is whether someone has taken 30 minutes to configure who gets which report, at what frequency, and with what threshold triggers.
Your Action List for This Week
- Identify which of the five reports above your current system already generates.
- Assign a named staff member as owner for each report type.
- Write down your three attendance intervention thresholds and share them with all class teachers.
- Check whether parent SMS alerts are being delivered — and whether parents are acknowledging them.
- If your system cannot produce mobile-friendly, real-time alerts, it is time to evaluate a replacement.
If you are ready to move from manual registers to a system that turns every scan into a live, actionable report, explore how scanix delivers RFID and QR attendance with built-in dashboards, instant parental alerts, and detailed reporting — starting at ?299 per student per year, with no hidden charges.
← Go to Blog Home Next Article : Future of Attendance Systems in India →
More Articles
Articles from our Blog you may also like

How ERP-Linked Attendance Wins School Admissions in 2026
Parents now audit school tech before enrolling. Learn how ERP-linked RFID attendance data becomes your strongest admission-season advantage in 2026....
Continue reading about How ERP-Linked Attendance Wins School Admissions in 2026 →
Lecture-Wise vs Day-Wise Attendance: Which System Wins in 2026?
Day-wise or lecture-wise attendance — which really works for Indian colleges in 2026? A practical guide for administrators who want compliance and control....
Continue reading about Lecture-Wise vs Day-Wise Attendance: Which System Wins in 2026? →
Smart Card Attendance for Govt Schools: A Principal's 2026 Playbook
Government schools across India are adopting smart card attendance. Here's exactly how principals can plan, implement, and sustain it in 2026–27....
Continue reading about Smart Card Attendance for Govt Schools: A Principal's 2026 Playbook →
Mandatory Biometric Attendance: Every School's 2026 Survival Guide
Biometric attendance is going mandatory in Indian schools. Here's exactly how principals can prepare, comply, and upgrade smartly in 2026....
Continue reading about Mandatory Biometric Attendance: Every School's 2026 Survival Guide →
Vahan Samvedak to Scanix: The Real-Time Safety Stack Schools Need
Bus tracking and attendance are two halves of one safety promise. Here's how Indian schools can unify both systems without doubling their budget....
Continue reading about Vahan Samvedak to Scanix: The Real-Time Safety Stack Schools Need →
College Bus + Attendance: One Safety System That Does Both
Bus tracking and attendance are two halves of student safety. Here's how Indian colleges can unify both systems without doubling their budget....
Continue reading about College Bus + Attendance: One Safety System That Does Both →
ERP-Enabled Schools: What Parents Check Before Admission in 2026
Parents now shortlist schools by their tech infrastructure. Here's how RFID attendance and live dashboards make your school the obvious choice....
Continue reading about ERP-Enabled Schools: What Parents Check Before Admission in 2026 →
Tamil Nadu's AI Attendance Shift: Your School's Action Plan
Tamil Nadu is rolling out AI-based attendance in schools. Here's what every principal across India must do now to stay ahead of the curve....
Continue reading about Tamil Nadu's AI Attendance Shift: Your School's Action Plan →
SIH Innovations to Daily Use: Future-Proofing College Attendance
Smart India Hackathon ideas are reshaping campus tech. Here's how college admins can turn innovation into reliable daily attendance systems....
Continue reading about SIH Innovations to Daily Use: Future-Proofing College Attendance →
DK's Rural RFID School: 7 Lessons Every Principal Needs
A rural DK school went fully digital with RFID turnstiles and smart classrooms. Here are 7 actionable lessons every Indian school leader must steal....
Continue reading about DK's Rural RFID School: 7 Lessons Every Principal Needs →
From Manual Rolls to Smart Cards: A 2026 Digital Attendance Playbook
Biometric mandates and smart card adoption are reshaping Indian schools. Here is your step-by-step playbook to upgrade attendance in 2026–27....
Continue reading about From Manual Rolls to Smart Cards: A 2026 Digital Attendance Playbook →
Government Schools Go Digital: Your Smart Card Attendance Roadmap
Govt schools are adopting smart card attendance fast. Here's a practical roadmap for principals to implement it smoothly and stay ahead in 2026....
Continue reading about Government Schools Go Digital: Your Smart Card Attendance Roadmap →
Digital Attendance Rollout: A Rural School's Practical 2026 Guide
Rural schools going digital face unique challenges. Here's a step-by-step guide to rolling out RFID attendance without disruption in 2026....
Continue reading about Digital Attendance Rollout: A Rural School's Practical 2026 Guide →
Teacher Attendance on Campus: Why Location Locks Matter in 2026
Jharkhand's campus-only teacher attendance rule is reshaping school accountability. Here's what every principal must implement right now....
Continue reading about Teacher Attendance on Campus: Why Location Locks Matter in 2026 →
Attendance Tech Budgeting: Justify Every Rupee to Your Trust
School boards are scrutinising every expense. Here's how principals can build an airtight business case for RFID or QR attendance investment in 2026....
Continue reading about Attendance Tech Budgeting: Justify Every Rupee to Your Trust →
School Attendance to Admission: Build Parent Trust from Day One
Discover how a live RFID attendance system wins parents during admission season and keeps them loyal throughout the academic year....
Continue reading about School Attendance to Admission: Build Parent Trust from Day One →
How Attendance Tech Earns Parental Trust Before Day One
Schools using RFID and QR attendance systems win parental trust instantly. Here is how to make every alert, report, and dashboard count in 2026....
Continue reading about How Attendance Tech Earns Parental Trust Before Day One →
How to Choose the Right Attendance System for Multi-Grade Schools
RFID, QR, or AI? Indian school principals reveal how to pick the right attendance system for every grade level and campus need in 2026....
Continue reading about How to Choose the Right Attendance System for Multi-Grade Schools →
How Schools Can Build a Bulletproof Attendance Audit Trail in 2026
Government mandates are tightening. Here's how Indian schools can build a tamper-proof attendance audit trail that satisfies regulators and parents alike....
Continue reading about How Schools Can Build a Bulletproof Attendance Audit Trail in 2026 →
Odisha's Smart I-Card Moment: What Every School Must Do Next
An Odisha student's GPS smart I-card went viral. Here's what school leaders must plan now to build a safer, smarter campus in 2026....
Continue reading about Odisha's Smart I-Card Moment: What Every School Must Do Next →
Going Digital: A Rural School's RFID Roadmap for 2026
Rural schools across India are going digital with RFID. Here's a practical roadmap any principal can follow to modernise attendance today....
Continue reading about Going Digital: A Rural School's RFID Roadmap for 2026 →
Biometric Attendance Mandate: How Indian Schools Must Prepare
Biometric attendance is going mandatory in govt and aided schools. Here's a practical guide for principals to prepare fast and choose the right system....
Continue reading about Biometric Attendance Mandate: How Indian Schools Must Prepare →
Attendance Automation for Coaching Centres: The 2026 Playbook
Coaching centres lose students and revenue to poor attendance tracking. Here's how RFID and QR automation solves it in 2026....
Continue reading about Attendance Automation for Coaching Centres: The 2026 Playbook →
Attendance Tech Showdown: RFID vs QR vs AI for Indian Schools
RFID, QR codes, or AI-based attendance — which tech fits your school best? A clear, practical breakdown for Indian principals in 2026....
Continue reading about Attendance Tech Showdown: RFID vs QR vs AI for Indian Schools →
Attendance Data as a Parental Trust Tool: A 2026 School Guide
Discover how Indian schools can use real-time attendance data to build deep parental trust, reduce complaints, and strengthen community bonds in 2026....
Continue reading about Attendance Data as a Parental Trust Tool: A 2026 School Guide →
Attendance Data That Drives School Accreditation in 2026
Learn how automated RFID and QR attendance data helps Indian schools meet accreditation and compliance benchmarks effortlessly in 2026....
Continue reading about Attendance Data That Drives School Accreditation in 2026 →
Attendance Beyond the Classroom: A 2026 Full-Day Student Safety Blueprint
From morning entry to evening dismissal, here is how Indian schools can build a complete student safety system using RFID and smart tracking in 2026....
Continue reading about Attendance Beyond the Classroom: A 2026 Full-Day Student Safety Blueprint →
Attendance Data for SIH & Accreditation: A College Admin Guide
Accreditation bodies and hackathons demand clean attendance data. Here's how college admins can build audit-ready records fast in 2026....
Continue reading about Attendance Data for SIH & Accreditation: A College Admin Guide →
Attendance ROI: How to Prove Tech Value to Your School Board
Struggling to get school board buy-in for attendance tech? Here's how to build a rock-solid ROI case that gets your proposal approved fast....
Continue reading about Attendance ROI: How to Prove Tech Value to Your School Board →
Attendance + Bus Tracking Together: The 2026 School Safety Guide
Indian schools are combining RFID attendance with bus tracking for total student safety. Here's your practical guide to building a unified safety system....
Continue reading about Attendance + Bus Tracking Together: The 2026 School Safety Guide →
Attendance Compliance Audits: How Principals Can Ace Them in 2026
Compliance audits on attendance are tightening across India. Here's how school and college leaders can stay audit-ready every single day in 2026....
Continue reading about Attendance Compliance Audits: How Principals Can Ace Them in 2026 →
Lecture-Wise Attendance Tracking: The College Fix for 2026
Lecture-wise attendance tracking is transforming Indian colleges. Here's what administrators must know to stay compliant and cut proxy for good....
Continue reading about Lecture-Wise Attendance Tracking: The College Fix for 2026 →
Annual Attendance Planning: Build a Foolproof System for 2026–27
New school year, same attendance headaches? Here's how Indian principals can build a reliable, tech-backed attendance system before Day 1 of 2026–27....
Continue reading about Annual Attendance Planning: Build a Foolproof System for 2026–27 →
GPS Smart ID Cards: What Every Indian School Must Plan For
GPS-enabled student ID cards are making headlines in India. Here is what school leaders must evaluate before investing in smart card technology....
Continue reading about GPS Smart ID Cards: What Every Indian School Must Plan For →
Attendance Data Parents Actually Want: A School Leader's Guide
Parents want more than a term report. Here's how Indian schools can deliver real-time attendance data that builds trust and cuts daily queries....
Continue reading about Attendance Data Parents Actually Want: A School Leader's Guide →
College Bus Tracking + Attendance: The Safety Stack Schools Need
Bus tracking and RFID attendance together create a complete student safety system. Here's how Indian schools can implement both in 2026....
Continue reading about College Bus Tracking + Attendance: The Safety Stack Schools Need →
Proxy Attendance Crisis: How Colleges Can Fix It for Good
Delhi HC's attendance ruling exposes a deeper crisis in colleges. Here's how smart RFID and QR systems eliminate proxy and restore trust in 2026....
Continue reading about Proxy Attendance Crisis: How Colleges Can Fix It for Good →
How RFID Attendance Cuts School Admin Work by 80% in 2026
Discover how RFID attendance systems are transforming Indian schools in 2026—saving hours of admin work and keeping parents informed instantly....
Continue reading about How RFID Attendance Cuts School Admin Work by 80% in 2026 →
From Raspberry Pi to RFID: Choosing the Right Attendance Tech
DIY Raspberry Pi setups sound exciting, but do they work for real schools? Here's a practical guide to choosing attendance tech that actually lasts....
Continue reading about From Raspberry Pi to RFID: Choosing the Right Attendance Tech →
Student Tracking Beyond Attendance: Building a Safer School in 2026
GPS smart ID cards are making headlines in India. Here's how school admins can build a complete student safety system starting with RFID attendance....
Continue reading about Student Tracking Beyond Attendance: Building a Safer School in 2026 →
Attendance Reports That Actually Get Read: A Principal's Guide
Turn raw attendance data into decisions. Learn how smart reports from RFID and QR systems help Indian school principals act fast and confidently....
Continue reading about Attendance Reports That Actually Get Read: A Principal's Guide →
NMC Bans Facial QR Attendance: What Medical Colleges Must Do Now
NMC has directed medical colleges to drop facial QR attendance systems. Here is what administrators must do next to stay compliant and accurate....
Continue reading about NMC Bans Facial QR Attendance: What Medical Colleges Must Do Now →
Multi-Campus Attendance Management: One Dashboard, Zero Chaos
Running two or more campuses? Learn how a unified attendance system saves time, cuts errors, and gives every stakeholder live visibility in 2026....
Continue reading about Multi-Campus Attendance Management: One Dashboard, Zero Chaos →
Smart Card Attendance for Teachers: What Schools Must Know
Government schools are rolling out smart card attendance for teachers. Here's what it means, why it matters, and how your school can get ahead....
Continue reading about Smart Card Attendance for Teachers: What Schools Must Know →
QR Code Attendance for Colleges: Cut Proxy & Save Hours Daily
Proxy attendance costs colleges hours every week. See how QR-based lecture-wise tracking stops fraud and gives admins real-time control in 2026....
Continue reading about QR Code Attendance for Colleges: Cut Proxy & Save Hours Daily →
Parent Alerts Done Right: RFID Attendance & Instant SMS in 2026
Learn how instant RFID-triggered SMS and app alerts keep Indian parents informed the moment their child arrives or leaves school in 2026....
Continue reading about Parent Alerts Done Right: RFID Attendance & Instant SMS in 2026 →
Geo-Fenced Attendance: Why Campus-Only Marking Matters in 2026
Jharkhand's campus-only teacher attendance rule is reshaping how schools think about presence. Here's what every Indian school admin needs to know....
Continue reading about Geo-Fenced Attendance: Why Campus-Only Marking Matters in 2026 →
Smart ID Cards in Schools: Beyond Attendance to Full Campus Safety
Smart ID cards do far more than mark attendance. Here's how Indian schools can use RFID-based cards to boost safety, parent trust, and daily efficiency....
Continue reading about Smart ID Cards in Schools: Beyond Attendance to Full Campus Safety →
AI Attendance in Schools: What Tamil Nadu's Bold Move Teaches Us
Tamil Nadu is piloting AI-based attendance in schools. Here's what every Indian principal needs to know — and how to future-proof your institution now....
Continue reading about AI Attendance in Schools: What Tamil Nadu's Bold Move Teaches Us →
RFID School Bus Tracking: Keep Every Student Safe in 2026
India is adopting RFID-based school bus tracking to protect students. Here's what principals need to know—and how to implement it effectively....
Continue reading about RFID School Bus Tracking: Keep Every Student Safe in 2026 →
RFID Smart ID Cards: The Safest Attendance Upgrade for Indian Schools
From Odisha to Tamil Nadu, RFID smart ID cards are transforming school attendance. Here's what principals need to know before making the switch....
Continue reading about RFID Smart ID Cards: The Safest Attendance Upgrade for Indian Schools →
HappyCards: Why This QR-Based Canteen System Is the Tech Innovation Schools Need Right Now
HappyCards is more than a payment solution—it is the next big leap in school technology. As an add-on to the Scanix RFID Attendance System, it transforms schools into smart, efficient, cashless campuses ready for the future....
Continue reading about HappyCards: Why This QR-Based Canteen System Is the Tech Innovation Schools Need Right Now →
How HappyCards Empower Parents & Students: A New Era of Control, Safety and Convenience
HappyCards is more than a cashless canteen solution—it’s a parent empowerment tool and a student-friendly innovation. When combined with Scanix, it completes the circle of safety, transparency, and efficiency that today’s schools demand....
Continue reading about How HappyCards Empower Parents & Students: A New Era of Control, Safety and Convenience →
Why School Canteens Must Switch to HappyCards: The Future of Cashless Campus Life
School canteens are transforming faster than ever. As institutions adopt modern technologies like the Scanix RFID Attendance System, enhancing the campus ecosystem becomes a natural next step. One area that needs immediate modernization is the school...
Continue reading about Why School Canteens Must Switch to HappyCards: The Future of Cashless Campus Life →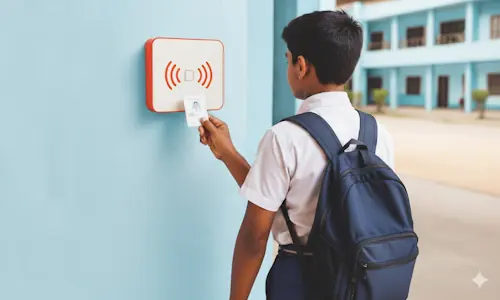
When a Beep Builds Trust: How Schools in India are Turning to RFID to Keep Parents at Peace
Every morning, Ritu Sharma’s heart races a little as she watches her 12-year-old daughter board the school bus. Like most working parents in bustling Indian cities, she juggles a packed schedule, yet her mind often drifts—Has the bus reached scho...
Continue reading about When a Beep Builds Trust: How Schools in India are Turning to RFID to Keep Parents at Peace →
Reusing Smart Cards: How Scanix Saves Money for Educational Institutes
In today’s fast-paced digital world, educational institutions are constantly looking for cost-effective solutions to streamline operations. One area where schools and colleges often face high costs is attendance management. Traditional biometric sy...
Continue reading about Reusing Smart Cards: How Scanix Saves Money for Educational Institutes →
Reducing Absenteeism: How Scanix Keeps Parents and Schools Informed
Absenteeism is a growing concern in educational institutions worldwide. Whether it’s due to illness, personal reasons, or a lack of motivation, missing school can significantly impact a student’s academic performance and overall growth. However, ...
Continue reading about Reducing Absenteeism: How Scanix Keeps Parents and Schools Informed →
Scanix for Multi-Location Institutes: Centralized Attendance Management Made Easy
In today's rapidly growing educational landscape, many institutions operate across multiple campuses or locations. While this approach offers flexibility and accessibility for students, it also brings significant challenges in terms of attendance man...
Continue reading about Scanix for Multi-Location Institutes: Centralized Attendance Management Made Easy →
How Scanix Reduces Teacher Workload and Maximizes Classroom Time
Every teacher starts their class with a crucial yet time-consuming task—marking attendance. While it may seem like a minor part of daily classroom operations, the cumulative time lost is significant. On average, a teacher spends 5 to 10 minutes cal...
Continue reading about How Scanix Reduces Teacher Workload and Maximizes Classroom Time →
Understanding RFID Technology: How Scanix Uses Smart Cards for Attendance
Radio Frequency Identification (RFID) is a wireless communication technology that uses electromagnetic fields to identify and track objects equipped with RFID tags. This system comprises three main components: an RFID tag, a reader, and a database. T...
Continue reading about Understanding RFID Technology: How Scanix Uses Smart Cards for Attendance →
RFID Attendance System: A Smart & Efficient Way to Track Attendance
Tracking attendance has come a long way from traditional roll calls to automated RFID attendance systems. Schools, businesses, and organizations are increasingly adopting this technology for its speed, accuracy, and convenience. In this blog, we wil...
Continue reading about RFID Attendance System: A Smart & Efficient Way to Track Attendance →
Why you need an Attendance Management System for your School
Whether it is school, college or university, an attendance management system plays an important role in effective student management. With the help of automation, the institute can bring faster, smoother and better attendance processes. Attendance i...
Continue reading about Why you need an Attendance Management System for your School →
QR Attendance Solution: A Game Changer in New Education System
In educational institutions, student participation in the classroom is directly related to their academic performance. However, the majority of student attendance registration is still conventionally done, which is tedious and time-consuming, especia...
Continue reading about QR Attendance Solution: A Game Changer in New Education System →
Future of Attendance Systems in India
The future of technology is bright in India and it is improving day by day. This improved technology has improved our way of living and also our way of doing things. From marking attendance to generating reports everything has gone digital. With time...
Continue reading about Future of Attendance Systems in India →Institutes already associated with us


Happy Clients
Channel Partners
Years of Experience
Strong Team